Apr 9, 2024
XRP Chart: A Look Back and a Glimpse Forward
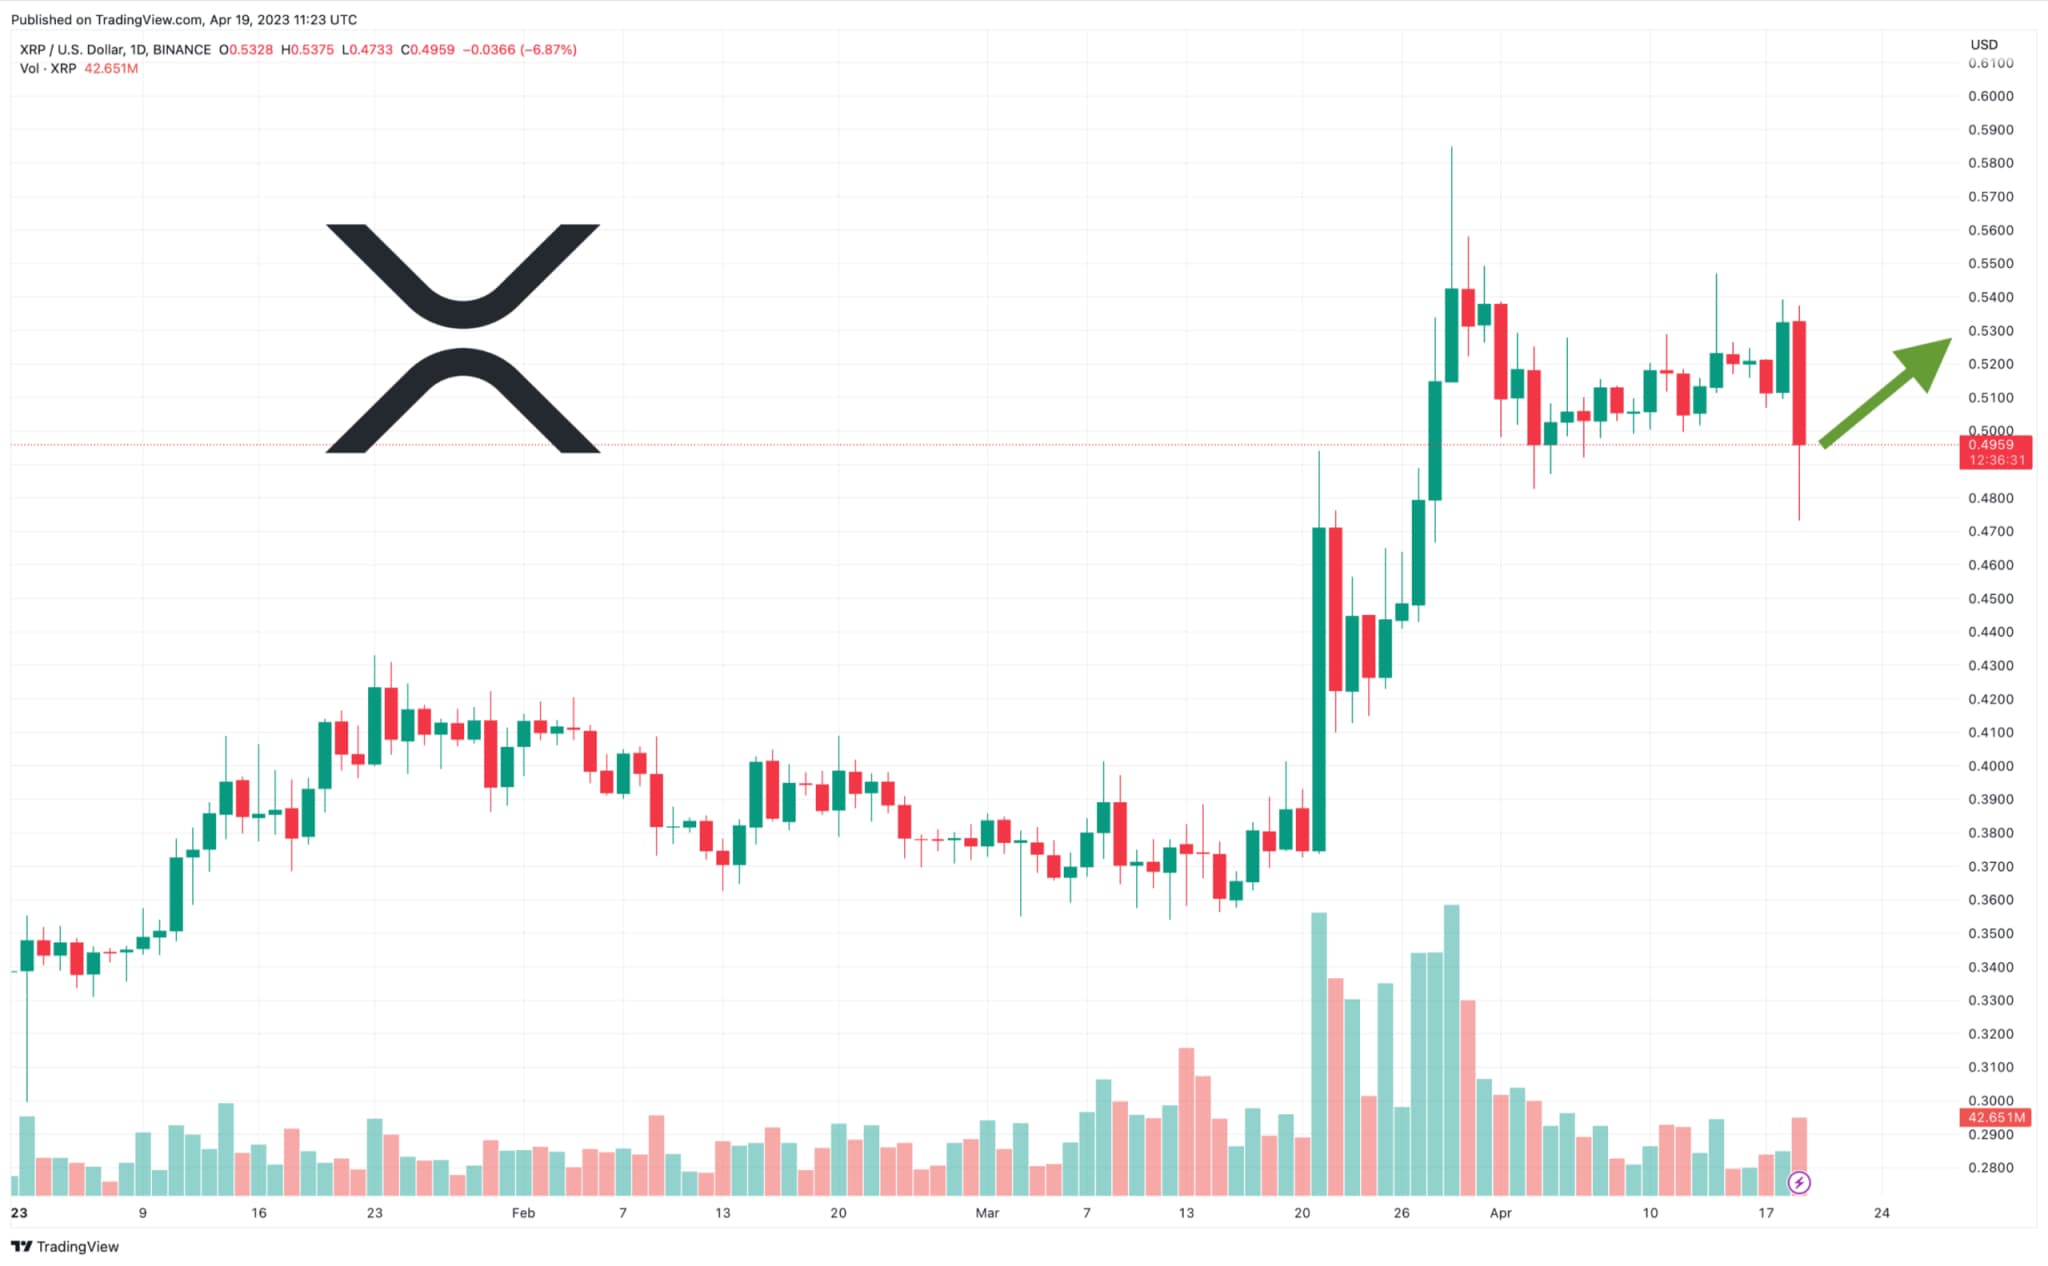
The XRP chart offers a window into the cryptocurrency’s past performance and can provide clues about its future direction. By examining the price movements over time, we can see periods of significant growth, like the 2017 surge where XRP skyrocketed over 50,000%. The chart also reveals areas of correction and consolidation. Technical indicators like support and resistance levels can be overlaid to identify potential price floors and ceilings. While past performance doesn’t guarantee future results, understanding these historical trends and technical signals can equip investors with valuable insights when navigating the ever-changing world of XRP.
XRP and Its Role
XRP is a cryptocurrency and token used within the Ripple network. Let’s delve into its role:
Facilitating Transactions:
- XRP serves as the token on the XRP Ledger. It facilitates transaction fees, costs, and provides liquidity.
- It is publicly available for purchase or trade on various exchanges.
Enhancing Cross-Border Transactions:
- The Ripple ecosystem was designed to enhance cross-border financial transactions by banks and financial institutions.
- Current cross-border transactions often occur between disconnected technology systems. Ripple’s solution uses an interledger protocol (similar to TCP/IP for the internet) to connect these systems.
- However, this protocol doesn’t solve the issue of pre-funding fiat currencies in accounts for foreign exchange transfers.
XRP’s Role in Liquidity Provision:
- This is where XRP comes into play. Ripple’s products utilize XRP to ensure quick liquidity.
- For instance, xRapid, another Ripple product, uses XRP as a “bridge asset”. Businesses and financial institutions can use XRP to bridge transfers between different fiat currencies.
- Financial institutions can purchase an equivalent amount of XRP and send it through Ripple’s network, enabling third-party liquidity provisioning.
- XRP helps banks that lack a corresponding relationship with each other.
Versatility of XRP:
- As a cryptocurrency, XRP has several use cases:
- Currency: Similar to the U.S. dollar’s role in international markets, XRP acts as a bridge currency for trade transactions and currency conversions.
- Security: Investors use XRP to store value and profit from price fluctuations.
- Commodity: It functions as a mechanism of exchange between different currencies or networks.
- Utility Token: XRP simplifies international transactions by enabling direct transfers without intermediaries
Current XRP Price and Market Performance
Let’s delve into the current XRP price and its market performance.
XRP Price Overview
The XRP price is currently $0.58401870, reflecting a -3.00% change over the past 24 hours as of 5:20 p.m. The recent price action in XRP has left the token’s market capitalization at $32.15 billion. So far this year, XRP has experienced a -5.28% change.
XRP: A Brief Introduction
- Classification: XRP is classified as a Currency under CoinDesk’s Digital Asset Classification Standard (DACS).
- Native Cryptocurrency: XRP serves as the native cryptocurrency of the XRP Ledger, an open-source, public blockchain designed to facilitate faster and cheaper payments.
- Cross-Border Transactions: Using XRP as a bridging currency, it’s possible to settle cross-border transactions in less than five seconds on the open-source XRP Ledger blockchain at a fraction of the cost of traditional methods.
- Pre-Mined Tokens: The original founders pre-mined 100 billion XRP tokens in 2012. No more XRP can be created. Ripple received 80 billion tokens for future operations, while the founders divided the remaining XRP among themselves.
- Escrow Account: In 2017, Ripple transferred 55 billion of its 80 billion XRP tokens into an escrow account. This improved transparency and predictability of XRP sales. Currently, the escrow account holds 46.5 billion XRP tokens.
Price History
- XRP’s price experienced significant jumps in the past:
- In December 2013, XRP surged almost 11-fold in 15 days.
- One year later, the price soared 454% in 33 days.
- Between March 2017 and January 2018, XRP went parabolic, rising by over 51,000% from under one cent to a height of $3.40.
- However, it failed to maintain momentum above the $3 level and eventually fell to $0.10.
- XRP remained beneath that level until April 2021 when the broader crypto market began to rise again.
XRP Chart Analysis and Future Outlook
In the dynamic world of cryptocurrencies, chart analysis plays a pivotal role in understanding price movements and predicting future trends. Let’s dive into the fascinating world of charts and explore the potential outlook for XRP.
Technical Analysis: Unveiling Patterns
Candlestick Charts
Candlestick charts are a popular tool for technical analysis. They provide insights into price action over specific time intervals (such as daily, weekly, or hourly). Here are some key components of a candlestick:
- Body: Represents the price range between the opening and closing prices during the given period.
- Wicks (Shadows): Extend from the body and indicate the high and low prices.
- Colors: Green (bullish) candles indicate price gains, while red (bearish) candles signify losses.
Support and Resistance Levels
Identifying support and resistance levels is crucial. These levels represent price points where buying or selling pressure tends to emerge. A breakout above resistance or below support can signal significant price movements.
XRP Chart Analysis
Recent Trends
Let’s analyze XRP’s recent performance:
- Consolidation: XRP has been consolidating within a range, forming higher lows and lower highs.
- Moving Averages: Pay attention to moving averages (such as the 50-day and 200-day). Crossovers can signal trend changes.
- Relative Strength Index (RSI): RSI helps gauge overbought or oversold conditions. XRP’s RSI can provide insights into potential reversals.
Future Outlook
While past performance doesn’t guarantee future results, here are some scenarios:
Bullish Case:
- If XRP breaks above key resistance levels (e.g., $0.65), it could rally further.
- Positive news (regulatory clarity, adoption, partnerships) may boost sentiment.
Bearish Case:
- Failure to hold support levels (e.g., $0.55) might lead to further downside.
- Negative news or market-wide corrections could impact XRP.
Neutral Scenario:
- Sideways movement may continue until a decisive breakout occurs.
- Monitor volume and news developments.
XRP Chart Risk Considerations
- Volatility: Cryptocurrencies are inherently volatile. Be prepared for sudden price swings.
- Market Sentiment: Sentiment can shift rapidly based on news, social media, and macroeconomic factors.
- Regulatory Landscape: Keep an eye on regulatory developments affecting XRP.
Conclusion
XRP continues to play a crucial role in cross-border payments and offers an alternative to traditional financial systems. Its price history reflects both volatility and moments of significant growth. As the crypto market evolves, XRP’s performance remains closely watched by investors and enthusiasts alike.
Remember that past performance is not always indicative of future results, and investing in crypto-assets carries inherent risks. Always conduct thorough research and consider your risk tolerance before making investment decisions.